Wrapping up Prime Day 2025 and Looking Ahead
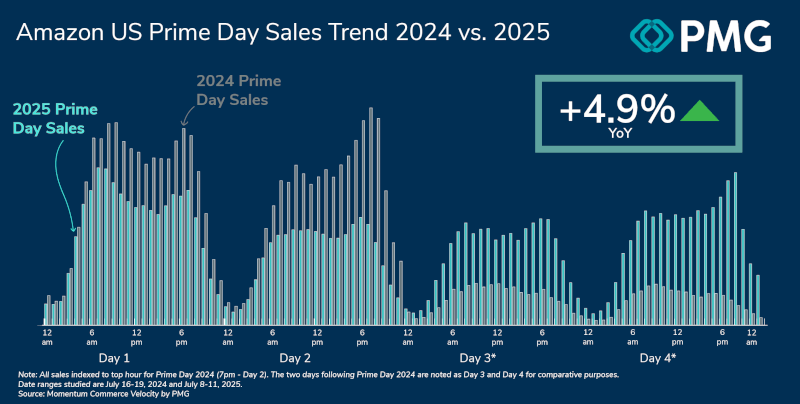
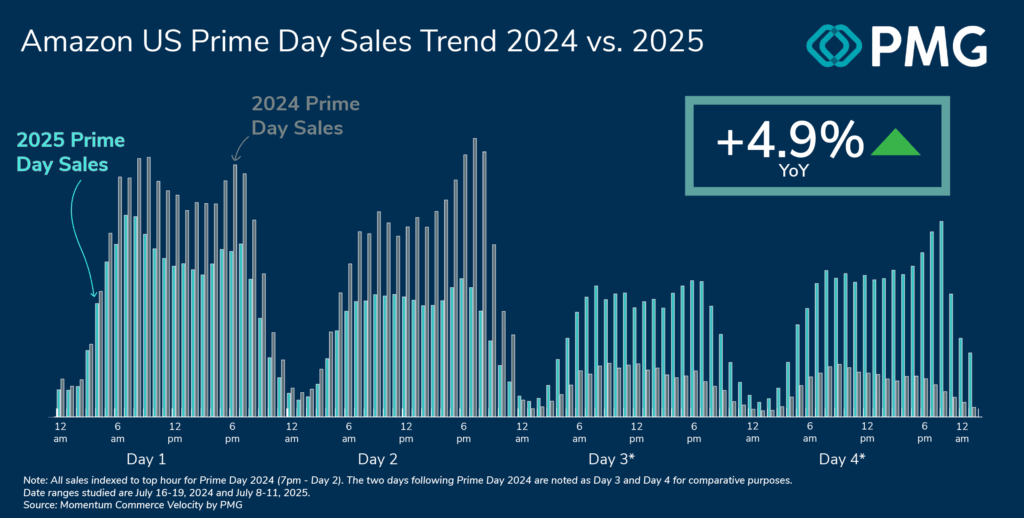
Prime Day 2025 was the biggest Prime Day yet, but it wasn’t without drama. Across our client set, which accounts for roughly $7B in annual revenue on Amazon US, we saw sales jump +4.9% across the four-day Prime Day in 2025 compared to the event last year combined with the following two days.
You may have seen some of this research cited by the likes of Bloomberg, Barron’s, EMarketer and many others. What grabbed headlines initially were depressed Day 1 sales compared to last year. But as we noted at that time, sales were still 477% above a typical day on Amazon, and we expected sales to be naturally lower early given the longer sale event, making ‘doorbusting’ type activity less critical for shoppers to nab the best deals.
This change underscores how, with the doubling in length of the sale event, the typical flow of hourly purchase patterns were upended during Prime Day 2025.
A late-event spike in conversions as consumers closed out their shopping carts on Day 4 helped push sales into YoY growth. But that spike moved from Day 2 last year to Day 4 this year.
When the dust settled, the +4.9% growth figure was below our initial estimate of +14%, but still represented another record-setting Prime Day on Amazon US.
Digging deeper though, this more modest-than-expected growth does hint at the impact of broader economic uncertainty, along with limits on how much Amazon lengthening sale events helps boost sales broadly. We’ve already seen Turkey 5 become Turkey 12, and the extension of the Big Spring Sale, but it’s an open question as to whether this continues across more sale events like Big Deal Days this Fall.
Zooming out a bit, Adobe observed a +30.3% YoY growth in sales across US ecommerce sites broadly during this year’s four-day Prime Day versus the two-day event last year. This stark difference in reported growth rates deserves careful examination, as it illuminates crucial distinctions in how Prime Day’s success can be measured.
Let’s break down why these numbers differ so significantly:
Scope of Analysis
- Our focus: Exclusively Amazon US marketplace performance
- Adobe’s scope: Broad US ecommerce landscape including other retailer websites and direct-to-consumer sites
- Impact: This was the first year where multiple ‘Prime Day-esque’ summer sales on competing top retailer websites ran concurrently with Prime Day on Amazon. Major players like Walmart, Target, Best Buy, Sam’s Club, Nordstrom, TikTok Shop, and Wayfair all ran promotions spanning the entire July 8–11 window. Additionally, Home Depot, Lowe’s, Kohl’s, and Old Navy held their own sale events for the first two or three days.
- Last year, the Walmart and Target sale events occurred the week prior to Prime Day, and outside of Best Buy, no other major ecommerce retail site ran a sale overlapping with Prime Day itself.
- This is a major change over 2024, and a big reason why year-over-year growth figures would be so strong across a broader cross-section of US ecommerce. Additionally, we saw anecdotal evidence of D2C sites showing particularly strong performance this year, pulling up the aggregate growth rate.
Data Sources
- Our analysis: Based on $7B in annual Amazon US revenue across our client base
- Adobe’s analysis: Broader ecommerce sampling across multiple platforms
This methodological context is particularly important this year, as Amazon has notably departed from their usual transparency regarding unit sales. In previous years, Amazon regularly disclosed specific unit sales metrics – a practice they’ve maintained for 7 of the past 8 years, with 2020’s pandemic-disrupted event being the sole exception.
The absence of these metrics this year, combined with the event’s extension to four days, makes third-party analysis more crucial than ever for understanding Prime Day’s true performance. Our focus on insights based on actual brand performance can help shed some light on what actually occurred.
Ultimately, the two analyses represent a kind of apples-to-oranges comparison. Our study was laser focused on the impact of Prime Day in relation to Amazon specifically. Adobe’s analysis provides insight on Prime Day’s impact across the broader ecommerce space.
Beyond sales, discounting trends were quite different from 2024. 25.6% of products on Amazon were discounted over Prime Day 2024. That’s up from an average of 23.6% last event, representing an 8% YoY increase.
But the depth of those discounts wasn’t as good as last year, on the whole. Across the first four days of Prime Day 2025, products discounted on the site had an average discount rate of 21.7%. That was down from 24.4% last event, representing an -11% YoY decrease.
We did see increasing discount depth and breadth through each day of the event, indicating that brands were baking in the idea of shoppers coming in later on in the sale event.
Together with PMG, we’ll be diving much deeper into what happened on Prime Day and what brands should learn from the 2025 event moving forward. Stay tuned over the next few weeks and we’ll be sharing a full-fledged, multichannel view of the event and the kinds of adjustments brands should consider for future sale events.
Be sure to sign up for our newsletter so you don’t miss it!