Amazon’s Pet Supplies Category Forecasted to Grow 25.3% YoY in 2024
This is the ninth in a series of category predictions using our Amazon Sales Forecast Dashboard.
What is the forecasted growth for the Pet Supplies category on Amazon US through 2024? How should brands in this category prepare their growth strategies? Over the next few months, we will be estimating specific categories’ 2024 revenue using our latest free tool, the Amazon Sales Forecast Dashboard.
Pet Supplies
Click Here to View the Dashboard
- What is the projected growth for the Pet Supplies category on Amazon US for 2024?
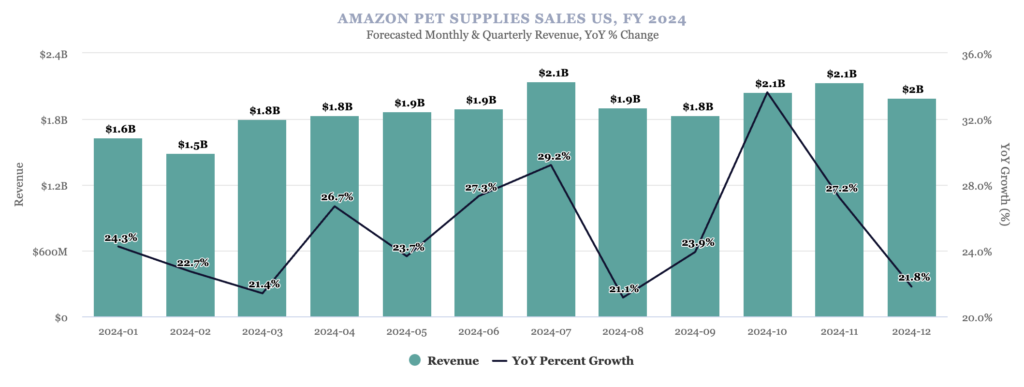
- The Pet Supplies category is forecasted to reach $22.6B in 2024 sales, up 25.3% year-over-year.
- How does the growth forecast for the Pet Supplies category compare to Amazon’s overall growth trajectory?
- Amazon is forecasted to grow 19.9% in 2024, whereas Pet Supplies is forecasted to grow 25.3% placing it slightly ahead of the overall site’s pace.
- What quarter will generate the highest Pet Supplies category revenue?
- Q4 is on track to bring in $6.2B, or roughly 27% of the forecasted revenue for the year.
- What month will generate the highest Pet Supplies category revenue?
- July and November are predicted to bring in $2.1B in the category, respectively. These months coincide with July’s Prime Day, and Cyber Week sales which often drive significant deals in the Pet Supplies category.
- What month is projected to see the highest year-over-year growth for the category?
- October is forecasted to have the most significant spike of +33.6% YoY.
Pet Supplies > Dogs
Click Here to View the Dashboard
- What is the projected growth for the Dogs subcategory on Amazon US throughout 2024?
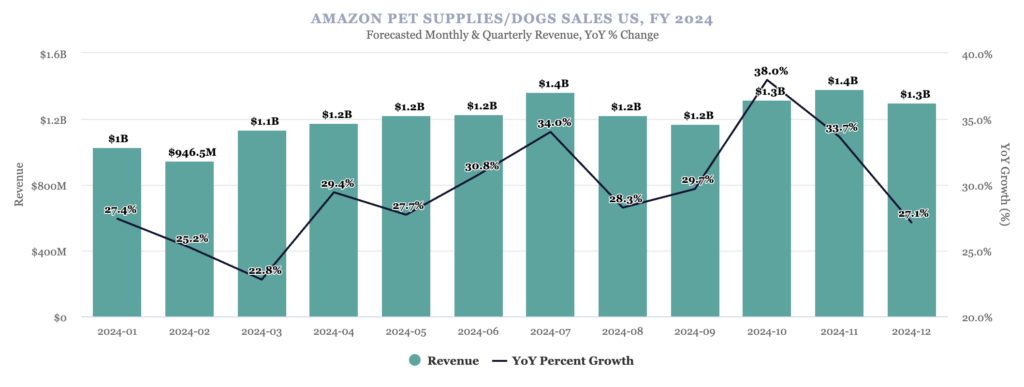
- The Dogs subcategory is forecasted to reach $14.5B in 2024 sales, up 29.7% YoY. This subcategory accounts for 64% of the overall category’s revenue.
- What is the forecasted pace of growth for the Dogs subcategory compared to the overall growth of Pet Supplies?
- The subcategory’s 29.7% YoY growth is pacing slightly ahead of the 25.3% growth projected across the Pet Supplies category as a whole.
- What quarter is forecasted to generate the highest revenue for the subcategory?
- Similar to its parent category, Q4 is forecasted to be the highest sales quarter with an estimated $4B in revenue.
- What month is forecasted to generate the highest revenue for the Dogs subcategory?
- Similar to its parent category, July and November are projected to be the biggest months, driving $1.4B in sales respectively.
- Which month is projected to experience the most significant year-over-year growth for the subcategory?
- October is projected to be the month with the most significant growth, at 38% YoY.
Pet Supplies > Cats
Click Here to View the Dashboard
- What is the projected growth for the Cats subcategory on Amazon US throughout 2024?
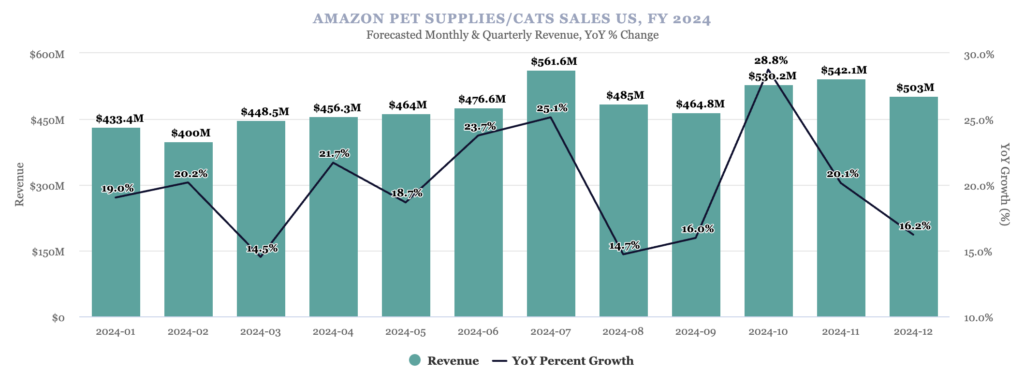
- The Cats subcategory is forecasted to reach $5.8B in 2024 sales, up 19.9% YoY.
- What is the forecasted pace of growth for the Cats subcategory compared to the overall growth of Pet Supplies?
- The subcategory is pacing to grow 19.9% YoY, while the overall category is projected to grow 25.3% YoY.
- What quarter is forecasted to generate the highest revenue for the Cats subcategory?
- Q4 sales are estimated to be the highest at $1.6B.
- What month is forecasted to generate the highest revenue for the Cats subcategory?
- July will be the highest revenue-driving month for this subcategory, with an estimated $561.6M in sales.
- Which month is projected to experience the most significant year-over-year growth for the subcategory?
- October is forecasted to see the most significant growth YoY at 28.8%.
Methodology
All forecasted sales figures are accessible through Momentum Commerce’s new Amazon Sales Forecast Dashboard. This free tool provides monthly Amazon US retail sales forecasts across hundreds of Amazon categories through the end of 2024. Revenue forecasts across thousands of deeper subcategory levels are available to Momentum Commerce’s services team and customers to further empower strategic direction and decision-making.
The forecasts and estimates within the Amazon Sales Forecast Dashboard are based on Momentum Commerce’s proprietary analysis and modeling, which incorporates multiple sources of Amazon US retail revenue data. Momentum Commerce regularly re-evaluates both the underlying data and models to ensure forecasts reflect seasonality, changes in observed revenue, and other factors.
Do you have questions? Reach out to us at hello@momentumcommerce.com