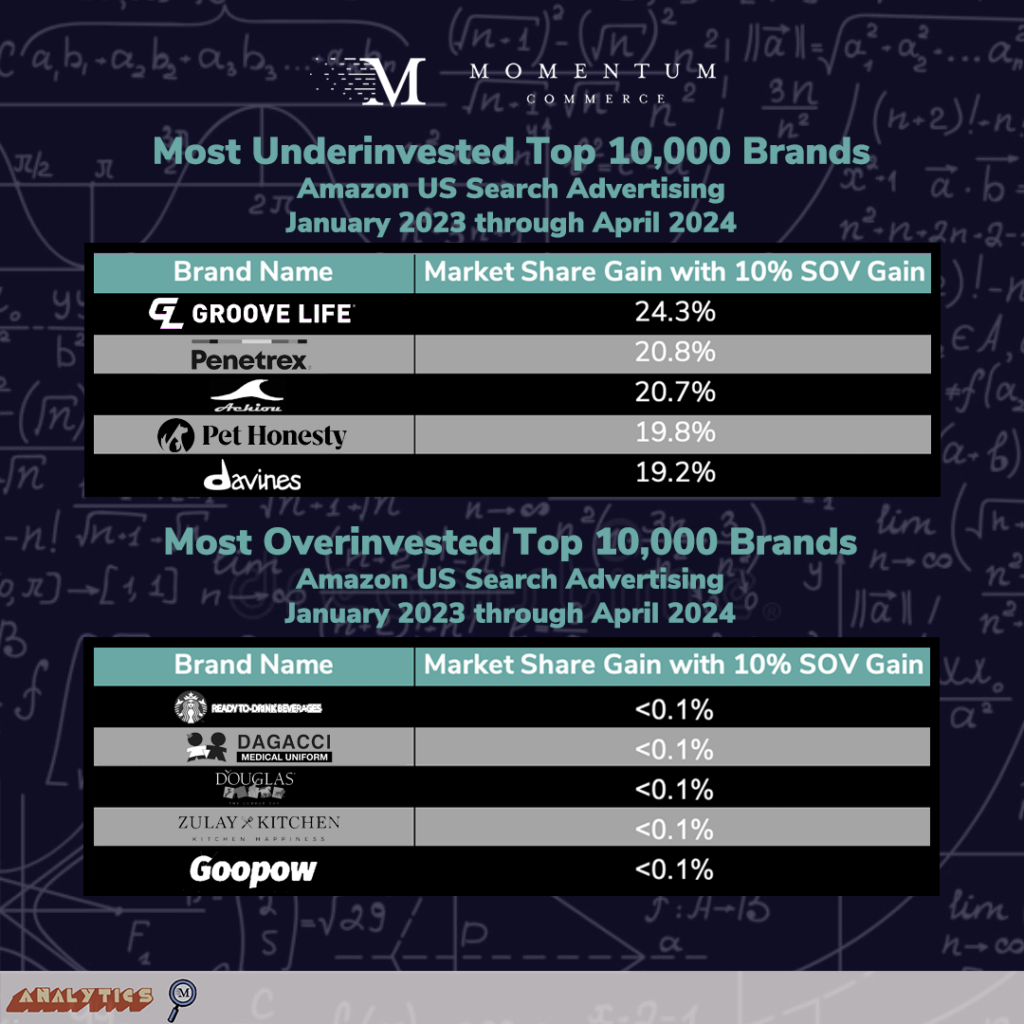
The Most Underinvested Brands on Amazon
A sizable share of the 10,000 largest brands on Amazon are likely significantly underinvesting in Amazon search advertising, with these brands demonstrating an exceedingly high level of marginal utility in terms of market share gains as their Paid Share of Voice (SOV) rises. Most strikingly, for more than 100 of the top 10,000 brands, a 10% increase in Paid SOV correlates with a more than 10% increase in that brand’s market share on Amazon US. This analysis underscores that brands need to better understand their respective degree of marginal utility of Amazon Advertising in order to effectively advocate for increased budgets, or alternatively focus more on optimization if marginal utility is low or negative.
It’s worth noting that in some cases, the biggest Paid SOV and market share gains for a brand came during peak periods (e.g. July for Prime Day, November and December for the traditional holiday shopping season). While these events present unique dynamics, a given brand’s ability to drive significant market share gains (not just revenue gains) over full monthly periods in conjunction with Paid SOV are worth taking as a strategic indicator of the likely impact of increased spend at other points of the year.
Biggest Takeaways for Brands
- Dig deeper on causes when it comes to plateauing Amazon ad sales growth
- Focusing on historical trends in terms of how increasing Paid SOV relates to any changes in revenue and market share is a good barometer to what strategies to employ going forward
- In cases where those numbers closely track, optimization could be more about intelligently expanding the keywords you’re targeting with given products based on competitive intelligence (for example, looking at popular keywords competitors rank for but your products do not)
- Conversely, if there is little to no relationship, pulling back to focus budget on high-performing keywords and more aggressive defense may help improve ROAS generally with minimal overall sales impact
- Focusing on historical trends in terms of how increasing Paid SOV relates to any changes in revenue and market share is a good barometer to what strategies to employ going forward
- Don’t assume that the size of your paid presence dictates your ‘runway’
- For example, Play-Doh – despite having nearly a 9% relevant category Paid SOV still has the degree of marginal utility where a 10% Paid SOV gain is correlated with a 10.1% increase in market share
- Alternatively, Yu-Gi-Oh! products have less than a 1% relevant category Paid SOV but have a marginal utility associated with a 1% market share increase for a 10% increase in Paid SOV
- These examples emphasize the value of deeper analyses like the one highlighted above to better understand the actual relationship between your brand’s Paid SOV and capturing market share
Methodology
Momentum Commerce analyzed monthly Amazon US sales estimates and monthly Paid SOV figures from January 2023 through April 2024 across the top 10,000 brands by revenue over that same time period, alongside the wider market. Monthly Paid SOV figures were averaged across the top three subcategories for each brand, with each subcategory encompassing at least 5% of the brand revenue. A linear regression was then calculated based on brand Paid SOV and brand Amazon US market share across relevant categories.
Figures are expressed as the percentage gain in market share achieved through a 10% increase in Paid SOV for that brand across its relevant categories.