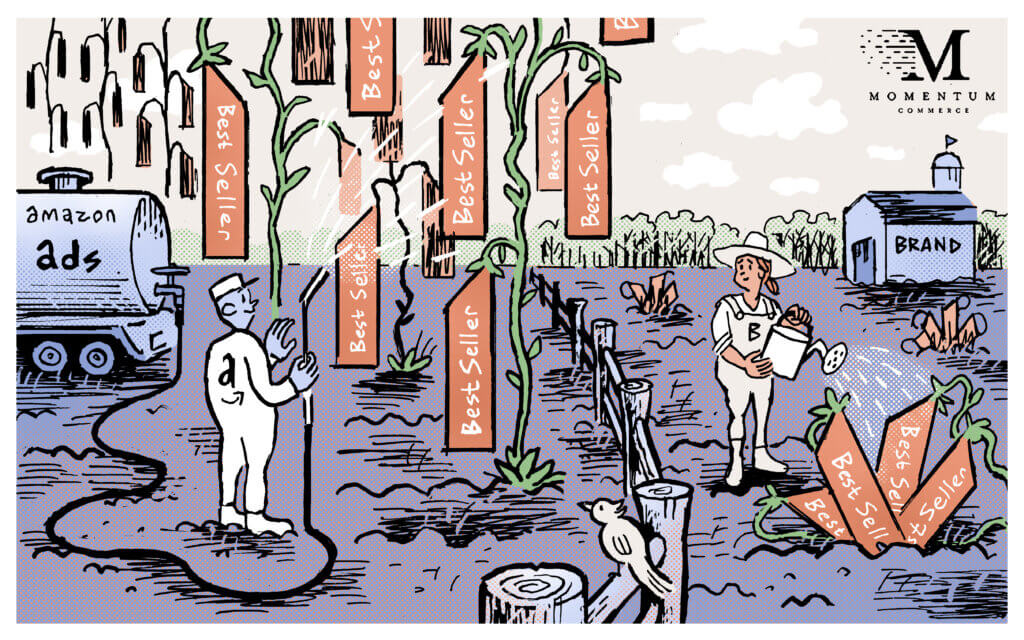
Holding a #1 Amazon Best Seller Rank is Worth 41.5% More Units Sold Per Week
Attaining a #1 Amazon Best Seller Rank (BSR) in a given category or subcategory is the proverbial holy grail for brands on Amazon. But is that holy grail worth the hype? What should brands expect from a sales perspective if they are able to hold that top spot?
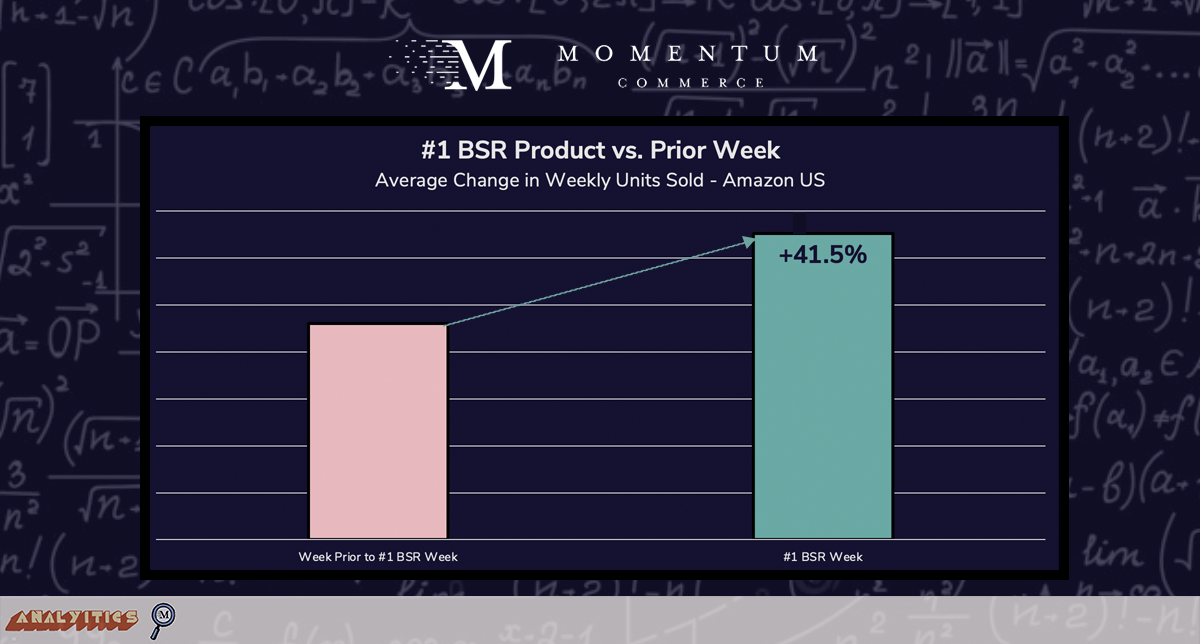
To effectively study the average sales difference of #1 BSR products versus prior performance, Momentum Commerce examined roughly one thousand ASINs who held #1 BSRs for at least one week from January through June 2023. This time period naturally strips out the most volatile, high-traffic periods on Amazon like Prime Day or Cyber Week. We then analyzed the average weekly units sold over the course of the #1 BSR week and compared that to the average units sold the week prior to attaining the #1 BSR.
The analysis showed that ASINs that captured and maintained a #1 BSR for a whole week drove an average 41.5% more units sold per week vs. the week prior to reaching the #1 BSR.
Biggest Takeaways for Brands
- If you’re able to capture a #1 BSR with a given product – you should absolutely “sweat” holding onto that spot
- While quantifying the sales impact of a #1 BSR is a bit of a ‘chicken and the egg’ problem (i.e. a #1 BSR product naturally means it’s the best-selling product in a category over a given period) – this analysis helps illuminate the impact of holding that top spot
- The sizable average benefits for products that sustained a #1 BSR are likely influenced by Amazon’s programs around those products (e.g. badging on the SERP, features in emails and messages to consumers)
- It’s worth using the 41.5% average within your own strategic planning around the ROI of achieving a #1 BSR
- For instance, if you have historical data supporting the Paid SOV and associated ad spend necessary to move from #3 to a #1 BSR, you can factor the average projected unit sales lift into your calculations
- However, keep in mind that the 41.5% figure is an average – and will almost certainly vary depending on several factors
- While brands can use 41.5% as a benchmark expected units sold increase, this may fluctuate significantly depending on a few key factors like seasonality, category depth, average category price point, and how ‘branded’ a given category is in terms of search activity
- We plan on analyzing some of these nuances in more depth in the coming months to provide additional guidance