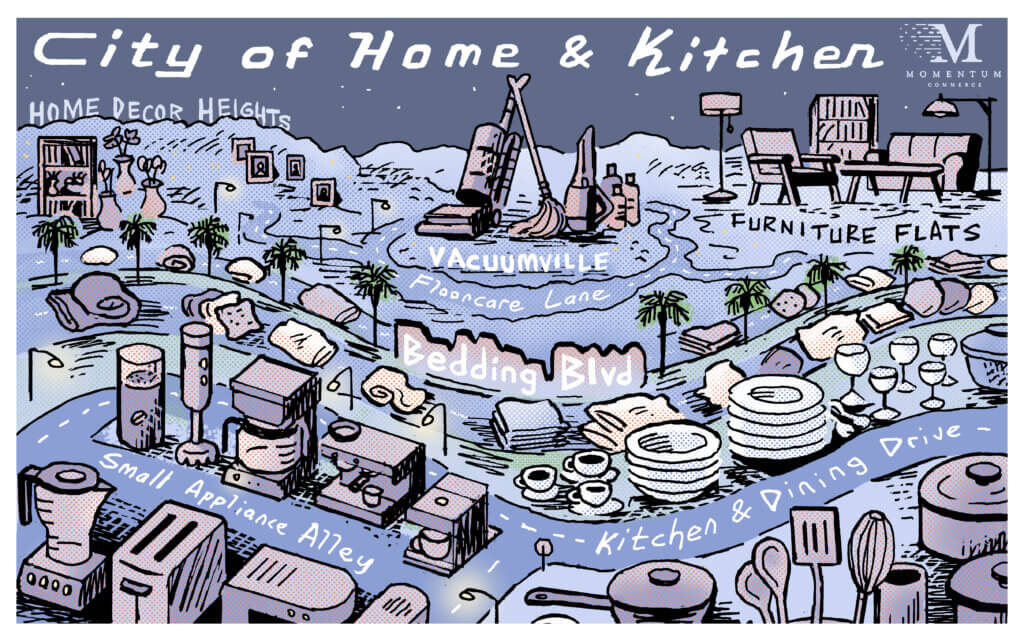
2023 Amazon Holiday Trends for Home & Kitchen: Total Revenue Rises 18.2%, Shark Ninja Pacing Amazon’s Most Searched Category
This is the third in a series of category-specific recaps focusing on this past 2023 holiday season.
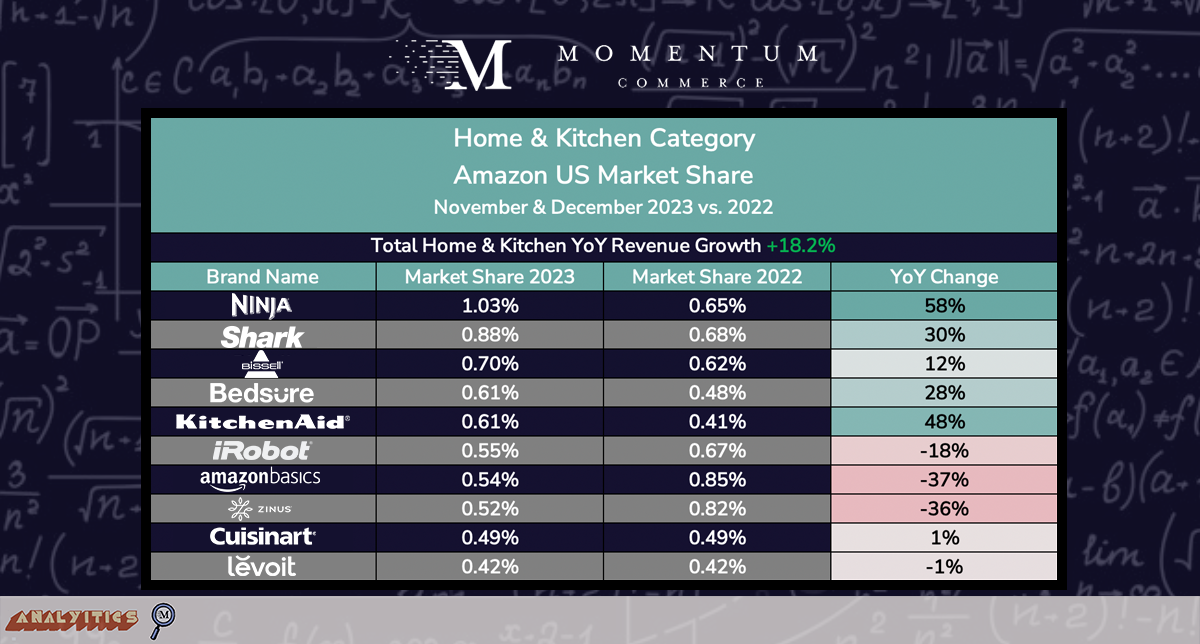
From November through December 2023, total sales across the Home & Kitchen category on Amazon US grew by 18.2% year-over-year (YoY), ballooning from $16.9B to $20B. Nearly all of the top brands by revenue in this category are concentrated in premium brands across vacuums, mattresses, and smaller home appliances, underscoring how Amazon remains a key retail channel for consumers shopping for big-ticket purchases. The wider category itself remains the most searched on Amazon.
Home & Kitchen Amazon US Revenue & Market Share Trends
Similar to Health & Household, the top brands within the Home & Kitchen category all hold relatively small shares of total category Amazon US revenue. Only small kitchen appliance brand Ninja (1.03%) has surpassed a 1% market share. But unlike the Health & Household category, where Amazon’s private label brands have dramatically increased their market share, Amazon Basics exhibited the steepest market share decline of all top brands studied in Home & Kitchen. This sharp drop comes despite Amazon Basics products driving the highest Paid SOV across top brands by a wide margin.
Biggest Takeaways for Brands
The data helps illustrate how success within the Home & Kitchen category is very subcategory and market-dependent. The lack of Paid SOV support across a number of top growing brands in this category on Amazon search emphasizes that users are increasingly shopping for Home & Kitchen products on Amazon with a brand already in mind. Top-of-funnel tactics are likely particularly important to driving demand given this dynamic.
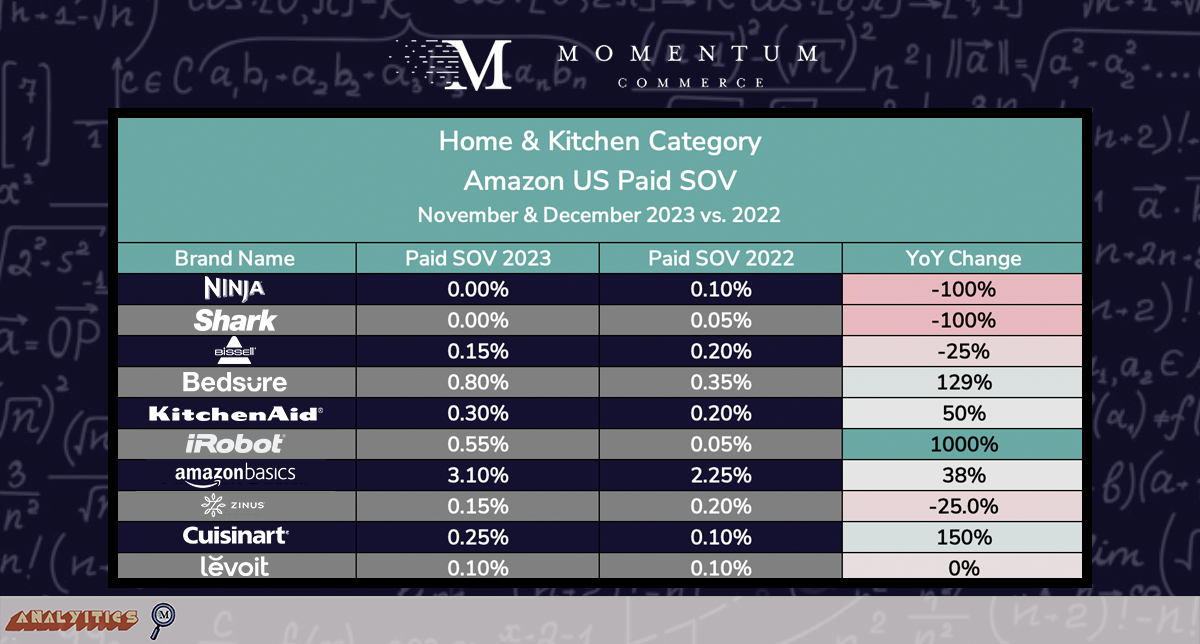
Home & Kitchen Amazon US Paid Share of Voice Trends
Ninja and Shark Paid SOV hit 0% over the study period – yet both grew their market share significantly YoY. Meanwhile, in the bedding subcategory, Bedsure more than doubled its Paid SOV while increasing market share, and Zinus saw a significant market share decline while dropping its Paid SOV.
Biggest Takeaways for Brands
Searches across the Home & Kitchen category include a brand name slightly less than 12% of the time. These rates increase substantially within bigger-ticket categories, and drop precipitously within more commoditized categories. Nearly 30% of Vacuum & Floor Care searches and 23% of Small Appliance searches include a brand name, both figures having grown YoY. Conversely, in Kitchen & Table Linens and Bakeware only about 1% and 5% of searches are branded, respectively. These rates also follow the level of revenue fragmentation across brands in each subcategory. For Home & Kitchen brands, it’s critical to match these more nuanced market dynamics to the larger advertising strategy. It’s going to be difficult for a new pressure cooker brand to break through simply using paid search, while that may be more achievable for a cutlery brand that operates in a less branded, more fragmented category.
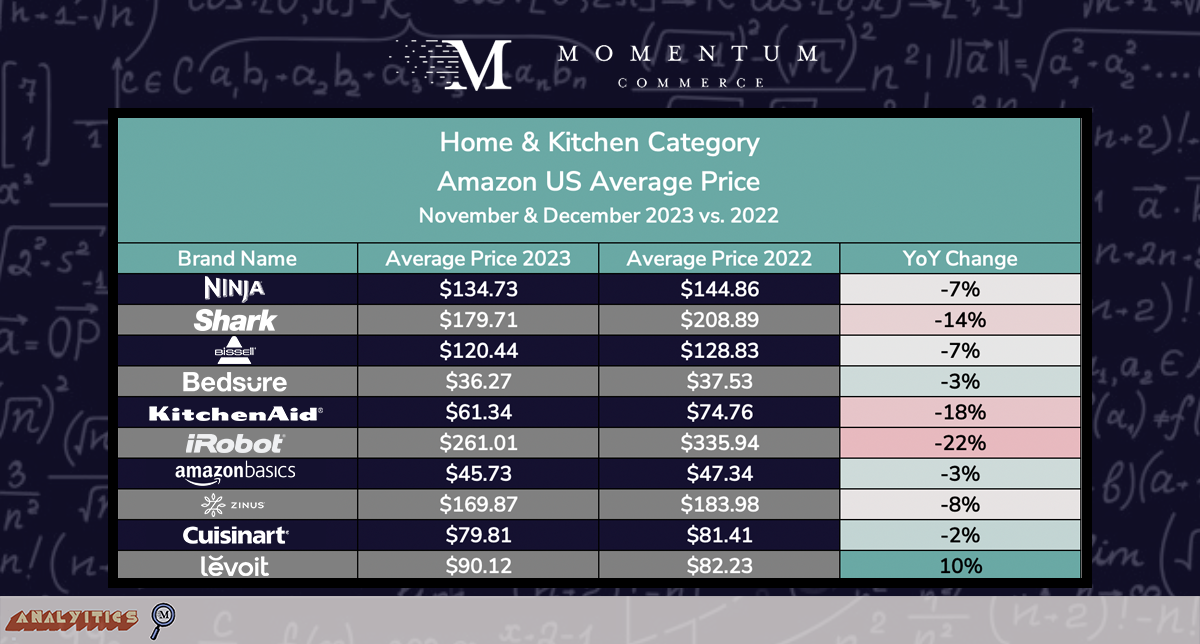
Home & Kitchen Amazon US Pricing Trends
Nine out of the top-10 brands in the Home & Kitchen category on Amazon US had lower average prices YoY during the holiday shopping season. iRobot (-22%) and Kitchenaid (-18%) exhibited the most dramatic price drops YoY, but most decreases were under 10%, further emphasizing that the branded nature of bigger ticket subcategories means that top brands are generally not employing heavy discounting within their Amazon strategies.
Biggest Takeaways for Brands
Brands that are driving significant branded search traffic while simultaneously increasing market share are particularly well positioned to use price as a lever to improve sales volume. Generally, all pricing decisions should be based on maintaining a price level that’s relative to a given product’s competitors seen within search results pages. Tracking the ‘relative price’ of a product, particularly for the biggest revenue-generating or highest-margin items, can enhance well-informed decision-making regarding pricing strategies. Price elasticity tests can help pinpoint an ideal discount rate that strategically positions the product against competitors while minimizing the impact on profit margins.
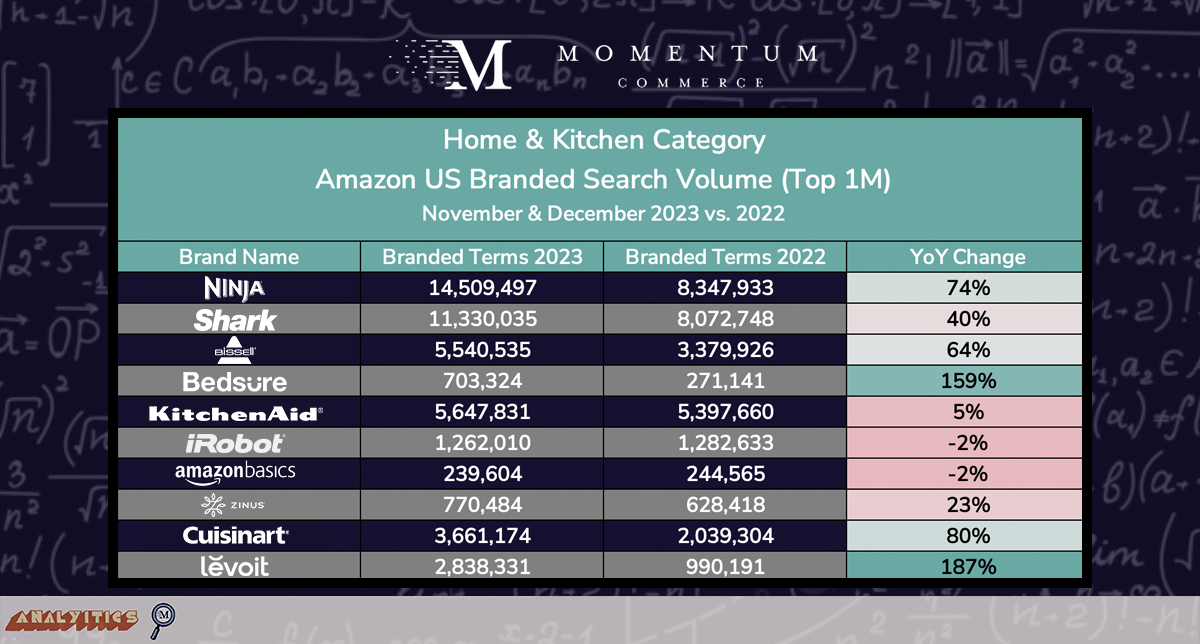
Home & Kitchen Amazon US Branded Search Volume
Across eight of the top 10 brands by revenue in the Home & Kitchen category, branded search volume across the top 1 million search terms rose YoY. This is particularly important across the bigger ticket subcategories that most of the top brands operate in, as highlighted earlier.
Biggest Takeaways for Brands
Just about any brand should view more branded search activity as a positive signal, and while this is particularly important given the more branded nature of higher-priced subcategories within Home & Kitchen, it’s also not a surefire signal of market success. Levoit nearly tripled its Paid SOV YoY yet their market share dropped slightly in the category. Like other categories, businesses should analyze the frequency of searches specifically associated with their brand within a broader product subcategory. Additionally, they should assess the proportion of sales generated through branded terms for that particular product across an extended timeframe. If these metrics consistently show low values, it is worth prioritizing more targeted strategies, such as search advertising across popular, relevant generic terms or implementing PAT campaigns targeting competitors’ products.