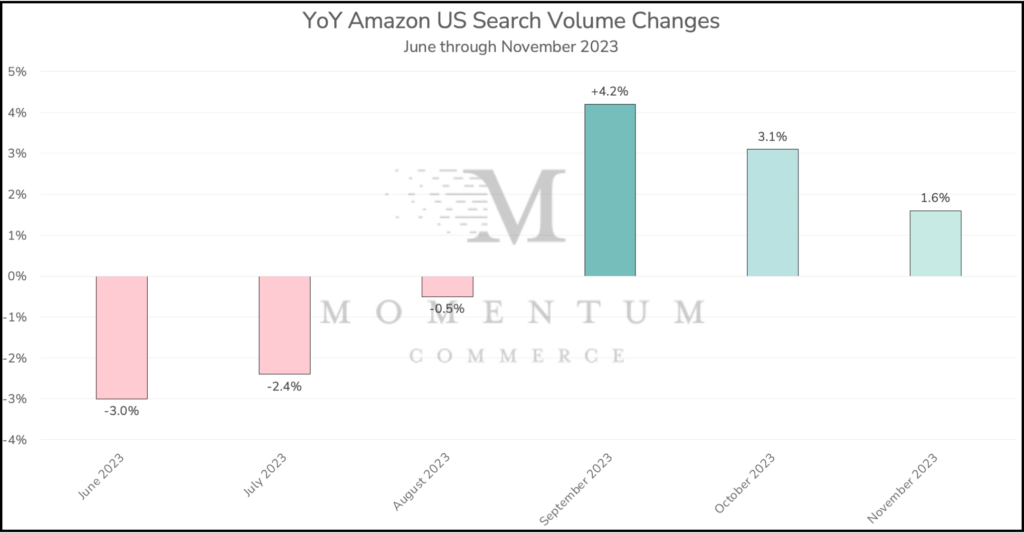
Amazon US Search Volume Climbs 1.6% Year Over Year in November 2023
Search volume across Amazon US rose by 1.6% YoY in November 2023, marking the third consecutive instance of year-over-year growth documented by Momentum Commerce. Search volume was up 18.3% from October 2023, likely as the result of Cyber Week. Similar to previous months in 2023, traffic was largely driven by CPG categories.
Biggest Takeaways for Brands
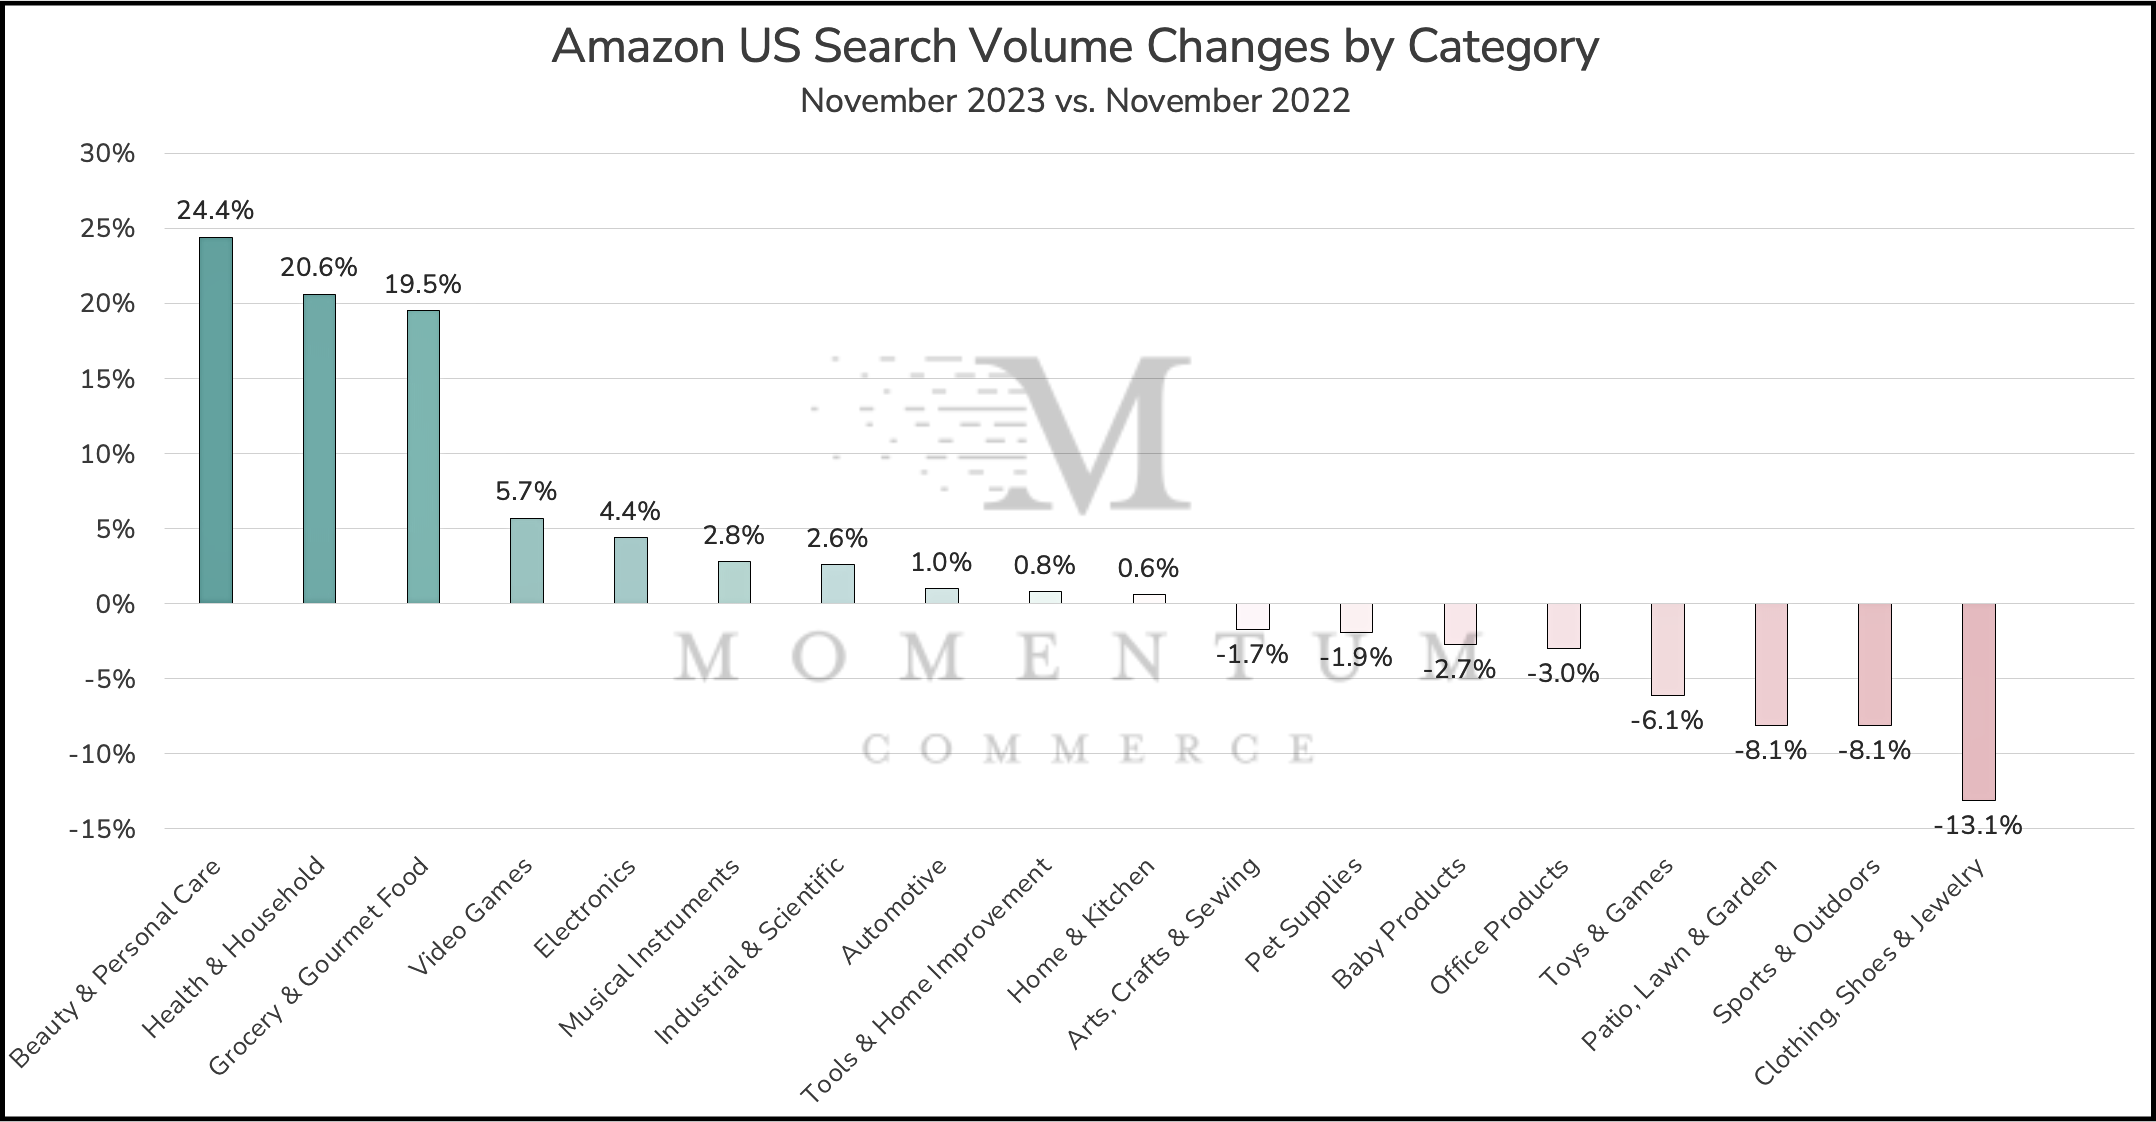
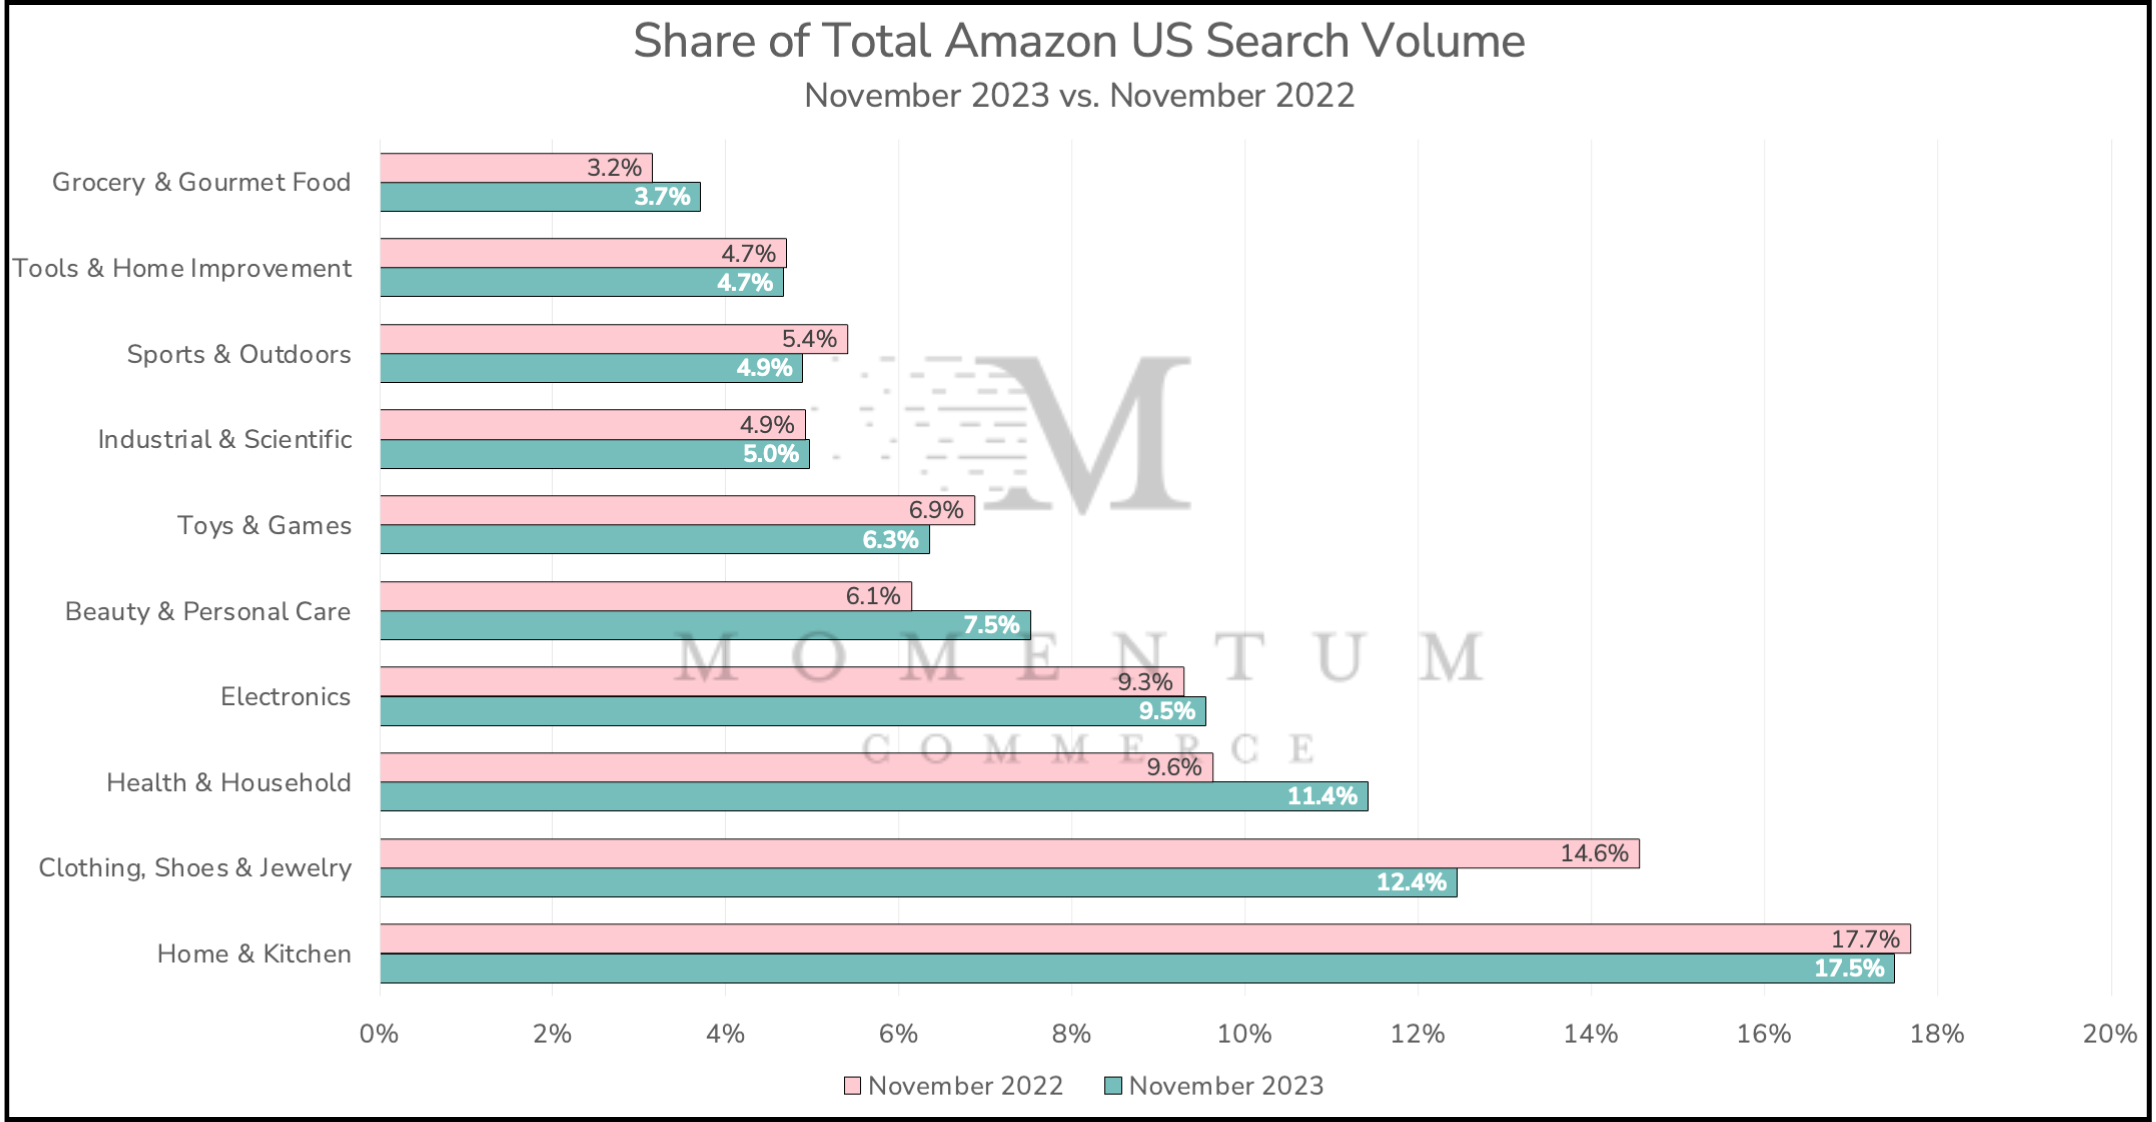
- Beauty & Personal Care posted a 24.4% YoY search volume increase- the largest of any top-level category.
- This is the fourth consecutive analysis where Beauty & Personal Care and Health & Household have posted YoY search volume gains of more than 20%.
- Beauty & Personal Care has once again asserted its dominance by recording the most significant year-over-year increase in search volume in November. In our previous analysis, Health & Household had achieved the highest year-over-year search volume increase, disrupting Beauty & Personal Care’s top position for the previous five analyses.
- CPG continues to be where the growth is on Amazon
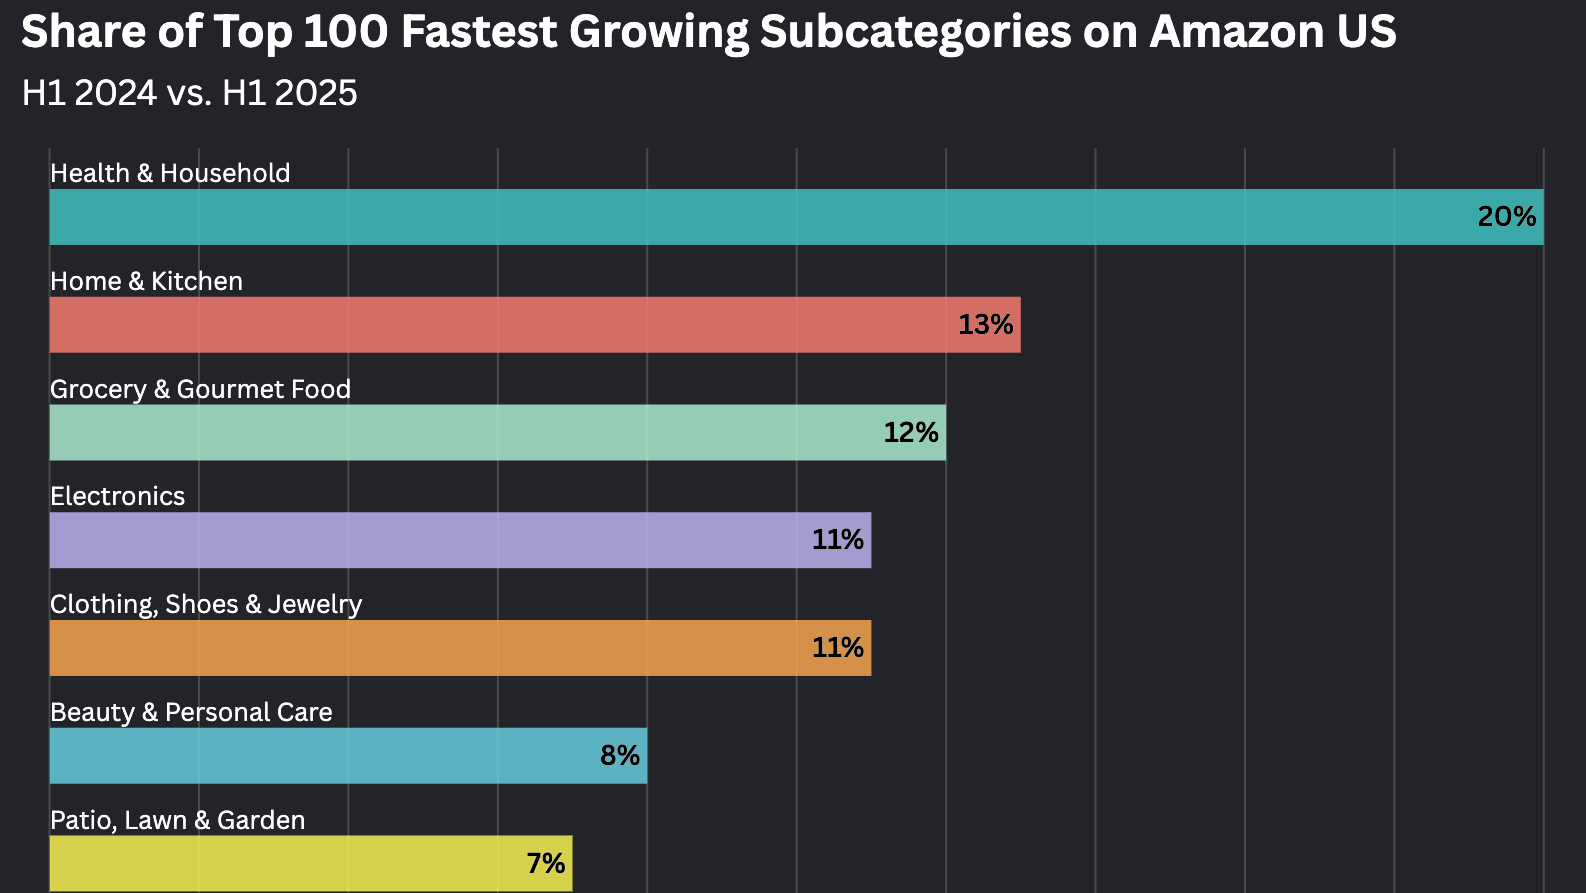
- Once again, the largest increases in share of total Amazon US search volume over the past year went to Beauty & Personal Care (+24.4%), Health & Household (+20.6%), and the Grocery & Gourmet Food (+19.5%) categories
- 23% of Amazon search volume was driven by these 3 categories, up from 19% one year ago.
- The shift towards CPG continues to come at the expense of hardlines categories.
- While Clothing, Shoes, & Jewelry ranks third as the most searched category on Amazon, it experienced a 13.1% YoY decline in search.
- Cyber Week didn’t provide a bump either, with Clothing, Shoes, & Jewelry being the only category to post a MoM search volume dip of 1.9%.
- For apparel, Sports & Outdoors, and toy brands, these traffic trends should underscore the importance of taking a data-driven approach to content, keyword, and advertising strategy
Methodology
Data included in this analysis is based on search volume estimates across the top 1,000,000 search terms on Amazon during November 2022 and November 2023. Search terms were categorized based on the top-level category associated with the majority of products appearing on the corresponding search results pages.
These models reflect the updates Amazon has made to their own search volume methodologies within Search Query Performance metrics. This includes all historical search volume estimations within this analysis.