The Value of #1 BSR Isn’t Constant – How Category & Price Point Impact Benefits
In an earlier analysis, we found that “ASINs that captured and maintained a #1 BSR for a whole week drove an average 41.5% more units sold per week vs. the week prior to reaching the #1 BSR”. But a caveat noted at the end of the piece was that the 41.5% figure was an average, and we expected variability if you broke down this metric more granularly. After breaking down the average units sold impact of attaining a #1 BSR by category, that qualifier was well warranted. The week-over-week change following a product reaching a #1 BSR ranged from +17.6% in the case of Electronics and its associated subcategories, to +93.7% for Industrial & Scientific and its underlying subcategories.
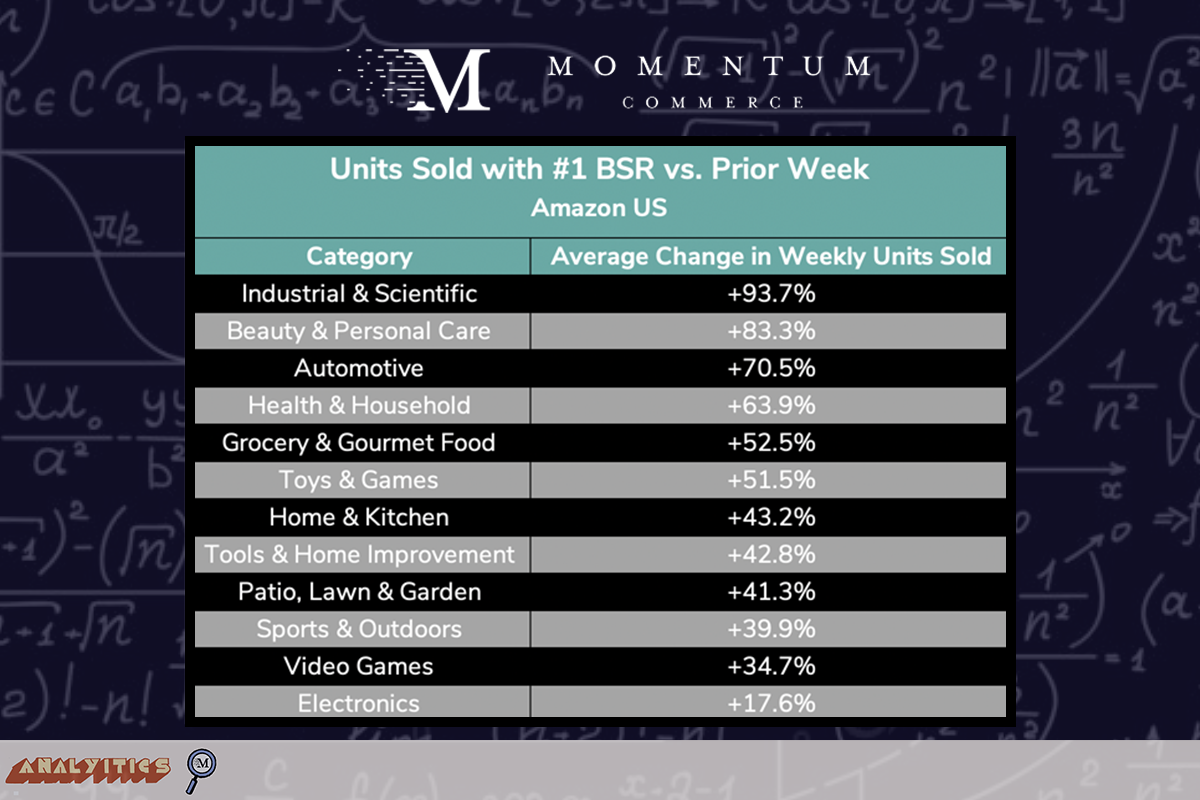
There are several likely reasons contributing to these stark differences.
- The categories boasting the largest week-over-week sales increases for #1 BSR products tend to be much more fragmented from a market share perspective, and slightly less branded in terms of search behavior
- Over the course of Q1 2023, just 4% of total category revenue was captured by the top five brands in the Industrial & Scientific and Beauty & Personal Care categories
- Over that same period, the top five brands drew in 37% of Video Games revenue, and 15% of Electronics revenue
- Meanwhile, branded search hit a high of 13% and 21% for Industrial & Scientific and Beauty & Personal Care, respectively, while reaching 23% and 45% in Electronics and Video Games
- In more fragmented, less branded markets, qualifiers like a Best Seller Badge can be a significant signal to consumers that this is a product that’s worth buying
- More seasonal categories tend to see less of a sales boost for #1 BSR products
- This may be a function of ‘spear fishing’ and filtering type search activity during peak periods, with users to be more prone to do multiple searches or filters until they find a product that suits their needs. We covered this phenomenon in this earlier piece of research, which is a behavior that would minimize the importance of a #1 BSR badge
- Electronics also tend to be more considered purchases, which naturally lends itself to multiple searches during the purchase journey
- In the case of Video Games, this may be around a new game release where users are naturally not swayed with a #1 BSR badge for an older game they aren’t shopping for
- This may be a function of ‘spear fishing’ and filtering type search activity during peak periods, with users to be more prone to do multiple searches or filters until they find a product that suits their needs. We covered this phenomenon in this earlier piece of research, which is a behavior that would minimize the importance of a #1 BSR badge
There are also clear, but less dramatic, differences in units sold impact when breaking down the analysis using product price ranges. The largest average week-over-week increase comes for products priced between $75 to $100, but both the under $25 and over $100 groups see units sold increases well ahead of the middle price buckets.
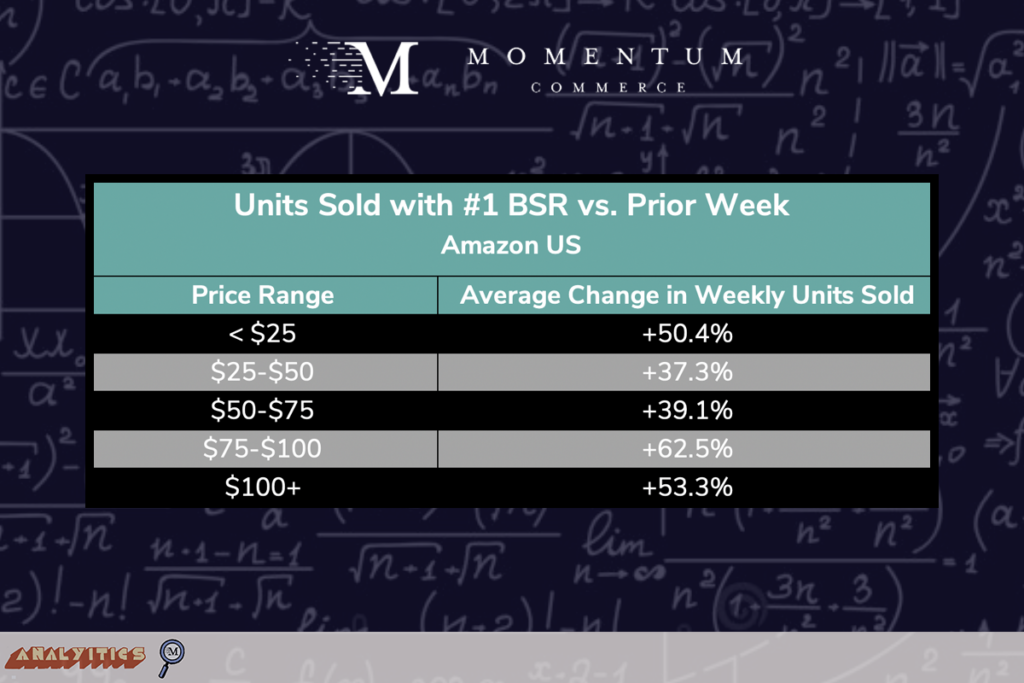
The under $25 group’s figure is likely a function of those products being weighted to more commoditized categories where a ‘Best Seller’ badge can influence a sale even seen within a basic, generic search. Meanwhile, the upper price band increases may be due to the opposite reason. Products in these buckets are naturally going to be more specialized, less numerous, and likely more considered purchases where the Best Seller Badge can help create a virtuous cycle in the final portion of a purchase journey. As a consumer narrows their search for a higher priced item based on their criteria, seeing the Best Seller Badge can act as a final catalyst to a purchase (e.g. “these products all have what I’m looking for – I’ll go with the best seller”).
Biggest Takeaways for Brands
- Always know roughly what it would take to reach a #1 BSR by using third-party data to help estimate the weekly sales of a given top BSR product for your category
- This will at least give you directional guidance on both the sales volume needed to supplant them, and you can back into expected costs given your sales history running promotions or larger advertising campaigns
- For brands in categories demonstrating the greatest benefit of a #1 BSR, zero in on what product can conceivably take you there, and plan accordingly
- Needless to say, if you’re more than a few spots away, getting a product to attain the sales volume necessary to reach a #1 BSR may take months or years
- Testing the impact of increased advertising activity and discounts can help set a much more actionable, realistic strategy for achieving the top BSR
- Do the research and don’t assume that achieving a #1 BSR is worth ‘whatever it takes’
- Depending on the size and nature of the category, the additional advertising or discounts necessary to attain a #1 BSR may not be ROI positive
Methodology
Momentum Commerce analyzed thousands of products that debuted on Amazon between January and March 2023, examining the average weekly sales for the first three months following launch date. Products were then segmented by top level category and average price over the study period. To ensure a more standardized sample, products that are no longer available on Amazon as of 2024 (e.g. due to limited availability, limited release, or delisting by Amazon) were excluded. Additionally, new child ASINs under existing parent ASINs were excluded from the analysis to ensure more meaningful comparisons. The specific date range was selected to remove the impact of Prime Day on performance data.